Tutorial - Creating Narrative Maps - Using StoryMap JS
A Narrative Map tells a story through space. A narrative map could trace an Oregon Trail traveler's movement through space using a diary or guidebook; it could plot the images on the map to show the distribution of the wreckage from the 1906 earthquake in SF; or it could trace the development of a city block using rich multimedia (videos, images, soundclips, and text). Narrative focus on storytelling, rather than on plotting massive quantities of data; and they can embed or integrate a variety of rich multimedia.
One tool we will use to create these narrative maps is StoryMap JS, a tool created by KnightLab. This tutorial will walk you through how to create a narrative map using this tool.
- Go to StoryMap JS, and select "Make a storymap now." You will need a Google Account to login.
- Click "New" to create a new map.
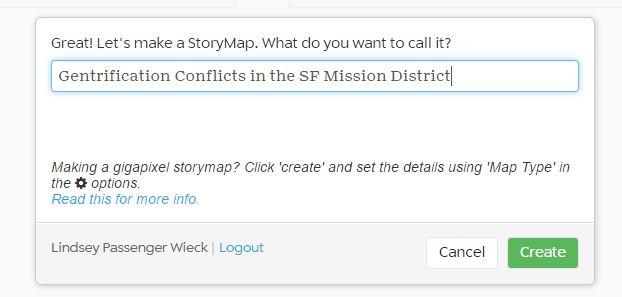
- Add a title to your StoryMap. I'm calling mine "Generation Conflicts in the SF Mission District", and click "Create"
- Add the title again in the bottom right corner under "Headline" - This screen allows you to customize the title / opening slide of your map.
- On the left side, click the "add slide" button. Drag and drop the pin on the map somewhere within San Francisco. Tip:If you ever lose your pin, click the slide thumbnail on the left, and it will recenter.
- Start by zooming into San Francisco, using the +/- zoom tools on the left corner of the map. Note: These don't appear until you click Add Slide. (You can also drag within the map to move it around).
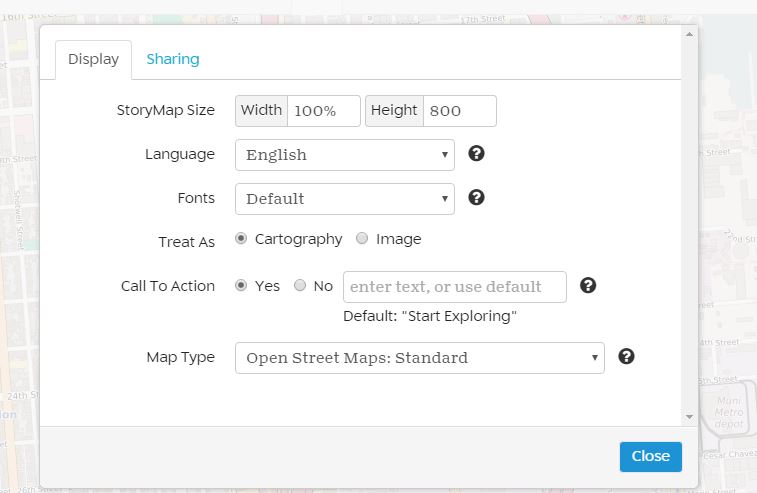
- While I love this Stamen map design, I want to find one that has more detail with more street names. Click Options in the Top Left corner. Under the "Design" tab, change "Map Type" to "Open Street Maps: Standard," and close. This map layer might be too chaotic, but it can help us identify street locations more easily for now. We'll talk more about these design options below.
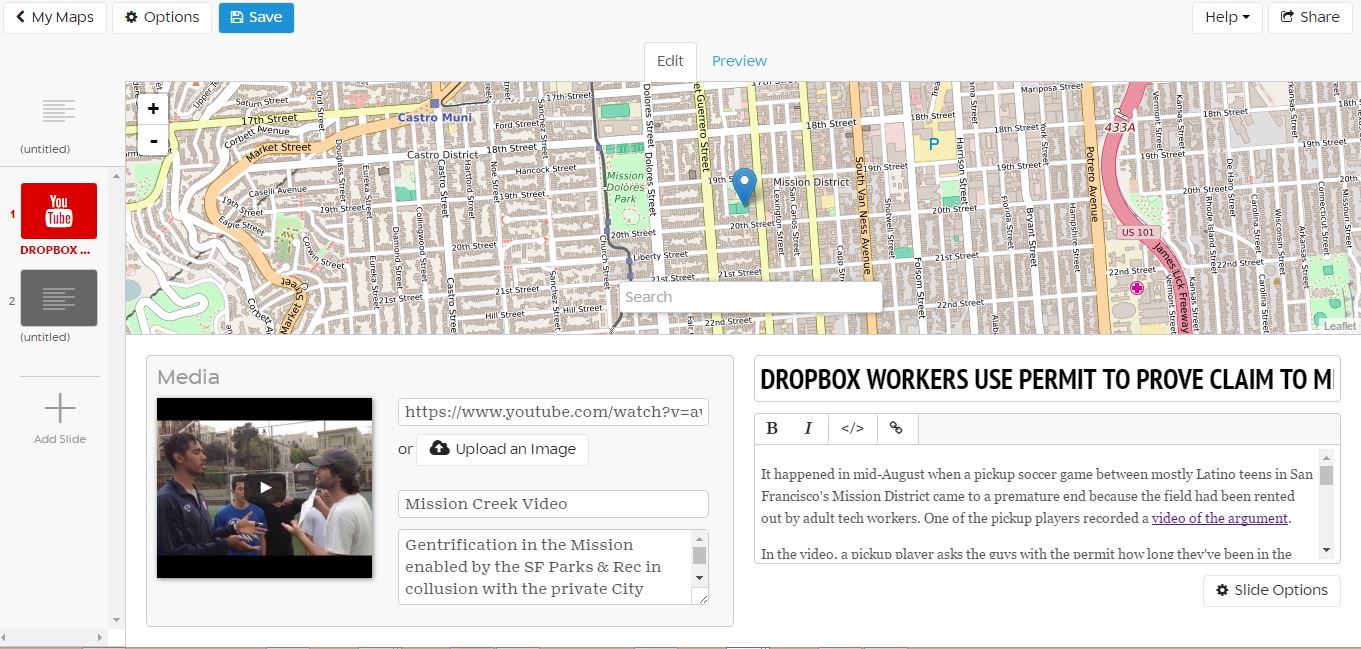
- Let's make our first slide:
- I want to highlight the Dropbox Soccer battle in the Mission. First I find the youtube link: https://www.youtube.com/watch?v=awPVY1DcupE and copy it into the "URL to your media" space. Note you can also upload an image.
- Always be sure to credit your image, so I add "Mission Creek Video, 2014"
- It's also great to add a caption. Think about this as an opportunity to contextualize or describe what viewers are seeing. (For great examples of captioning an image, see Jessica Sewell's Figure Descriptions). Because we're just practicing, I'm going to use the description from the youtube video as my caption.
- Next add a title for this slide: I added "Dropbox Workers Use Permit to Prove Claim to Mission Soccer Field" in the "Headline" field.
- Now add some descriptive text. Again, because this is just practice, I've used some text from an article about the incident (citing it at the bottom)
- Finally, I have to determine where to place the pin on the map. I searched for the location of "Mission Playground" on Google Maps (Just South of 19th Street, just East of Guerrero Street (you can see the green park space on the map)), and I dragged my pin there.
- Now that we've created our first slide, click "Preview" on the Top Center of the screen to view what this slide looks like.
- Next add a new slide for the Local's Corner debate.... but, wait, this event happened in 2013, a year before the soccer video. Drag and drop slide 2 before slide 1 to reorder them. Becayse StoryMap provides a great way to order events temporally by linking them in a pre-specified order, it's helpful to arrange your slides in temporal order if this is important to your project.
- Next we'll add the Local's Corner Restaurant conflict:
- First you'll need to find the location of Local's Corner (restaurant now closed) to plot on your map. I found it via Google.
- Now find an image to save on your computer and import into this slide. (here are two sources: Uptown Almanac and SF Chronicle)
- Fill in your credit / headline / captions (no need to craft anything custom here, just copy / paste and cite).
- Go back to Preview now, and view how StoryMap connects your slides. Also try out "Map Overview" and "Back to Beginning" buttons to test out how they act.
- Now that we've plotted some points, let's change our map style back to something more simple. (Options - Display - Map Type) Try out some of the Stamen Maps. Which do you like best? (Mapbox and the others below offer opportunities to add customized base layers to your map.)
- StoryMap can handle a variety of customized media types, including flickr, Twitter, Vimeo, Soundcloud, Wikipedia, and Storify. As an example of what some of these look like, please view this US Manifest Destiny Map.
- Now, if you go to "Share" in the top right corner of your map, there's a link at the top that you can use to link to your map via your blog, Twitter, or other social media platforms. Because we're using a Wordpress-hosted blog, we cannot embed the maps into our blog. Two tricks you might use to bring a preview of your visualization to your blog: 1) Use a screenshot as the Featured Image on your blog post; or you can use a screenshot as an image within your post as a link to get to the visualization.
- Under share, there are also spaces to specify how your map will appear if shared on social media (description and featured image).
- If you were using a blog on your own server, for example, to EMBED your maps into your blog, click "Share" in the top right corner of your map. At the bottom, use the block of code to Copy/Paste that into your wordpress page under the HTML tab.
Congratulations, you just created your first map!
- Once you've finished, take a brief look at some of the examples of StoryMaps like Dead and Buried, Hockey, hip-hop, and other Green Line highlights, Calculating Against the Odds, and Hong Kong: A Key Ivory Trade Hub.
- If you'd like a video walk through of StoryMap JS, see this one by Rebecca Wingo, Macalester College.
 >
>
 >
>