Tutorial: Gathering and Curating Data
An opening exercise
Consider this quote:
Met Helen at 18th & Castro and we went down town. She had some errands to do, and I trailed around in her wake. Then went to the Owl, to show them my rubber gloves. After much time and argument they offered me another pair at half price. I said I wouldn't do it, so they gave me another pair. Then I left Helen and rushed to Hale's, where Kate was waiting for me. She had a turban she had made for me--with much pains and I wore that. We lunched at the Tivoli Café, then went to the Penn. Ins. where she arranged to have the policy made over to me--after her.
Brainstorm how we might begin gathering data from this diary excerpt. Consider:
- What is interesting about this quote? How might we visualize it?
- What type of data could we gather from it?
- In what ways is this data incomplete // what would we need to supplement it?
- How might we approach tackling a project using this source?
Gathering Data via Phonebook
- If you haven't yet done so, download the 1907 Crocker Langley SF phonebook
- Let's briefly familiarize ourselves with the format. You'll find the following within:
- p. 24 (of pdf): Index of advertisers
- p. 29: Misc. City Info starts
- p. 67: City Street Director starts
- p. 108: Phone Book begins. Note that the phonebook lists professions for individual residents. Also note abbreviation code here
- p. 1723: Classifieds section begins.
- Note that some other phonebooks (like Polk's) list a block-by-block listing of homes and businesses also.
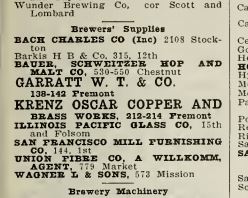
- Let's begin to gather some data. I'm curious how the distribution of breweries and brewer suppliers changes before and after the 1906 Earthquake. Following patterns of industrial migration and using the aftermath of the earthquake to rebuild downtown, I posit that the distribution of these spaces will scatter further to the outskirts of SF after the earthquake. Go to page 1769 in the pdf.
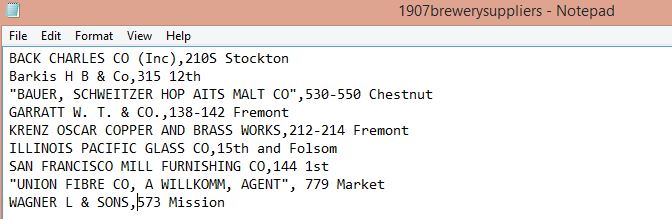
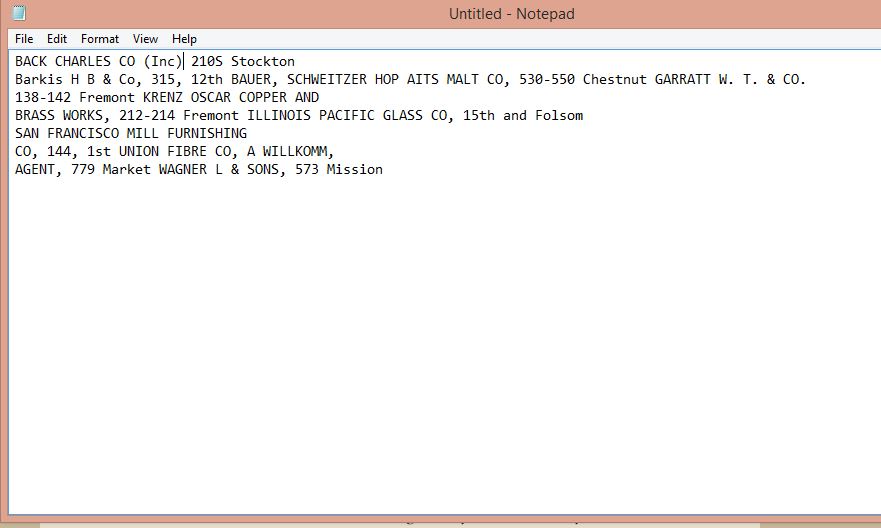
- Select the text under "Brewer's Supplies" on p. 1769 (p. 1775 is the number listed on the page in the book) and copy and paste it to a blank text document. (You can use your basic text editor like Notepad for Windows or TextEdit for Mac -- DO NOT USE Microsoft Word. You can also use an editor like Atom or Sublime if you already have it installed.)
- Let's start to clean up this data.
- We want to turn this into a csv (comma-separated values) file (a type of file that stores tabular data as plain text), so we will need to separate the values with commas. Insert a comma between the name of the business and the address, and remove any extra spaces. (e.g. in the first line, place a comma between (INC) and 210S and remove the space).
- After the end of each address, we want to end the line with a hard return (e.g. push return after 210S Stockton)
- If any lines use commas in the name, (e.g. Bauer, Schwitzer), enclose the entire string within quotes: (e.g. "Bauer, Schwitzer Hop and Malt Co.",530-550 Chestnut)
- Compare the text in the text editor with that of the original and correct any errors that the OCR (optical character recognition) made. (e.g. 201S Stockton --> 2018 Stockton; AIT --> AND.)
- Phonebooks tend to put punctuation between a street number and a numerical street name to separate them (e.g. 144, 1st) -- be sure to remove this extra comma
- Save your file as a 1907brewerysuppliers.csv. The .csv addition is important in denoting this as a comma-separated value file.
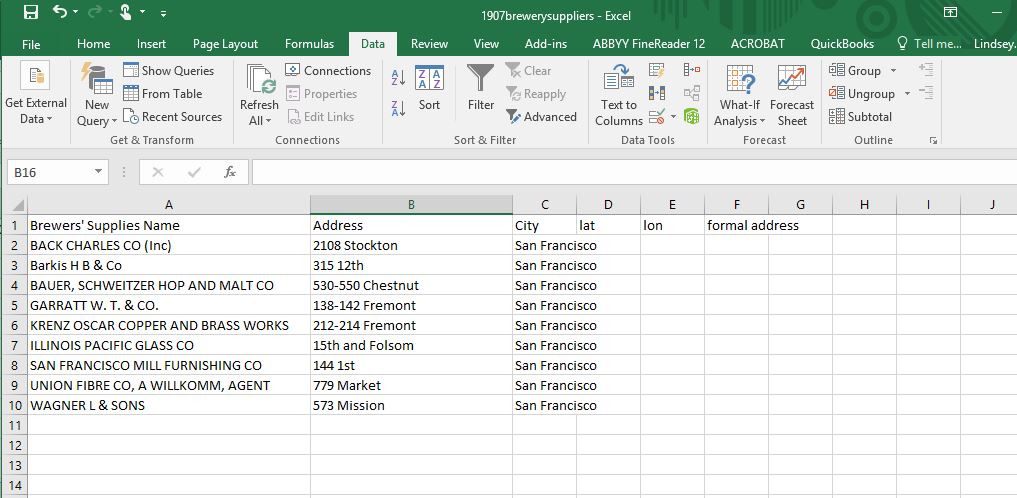
- It's often useful to manipulate this data in a spreadsheet. You have two options for how you can get this data there. One option is to open the csv file in a spreadsheet (the default way that computers open csv files), or to copy and paste from your text editor into a spreadsheet. In excel, then you can highlight the column with your data, click on the data tab and then click Text to Columns. Either way you should now have your data organized in rows and columns.
- Insert a row at the top to insert header categories for Brewer's Supplier / Address / City / Lat / Lon / Formal Address (only Supplier and Address is filled now).
- Next, we'll fill the City column. In the top box under the City label (C2), type San Francisco. Click C2 and drag down to C10 (this should fill all your used lines) and click CTRL+D (or Command+D), to fill down. Now all the boxes say San Francisco to help us geocode them.
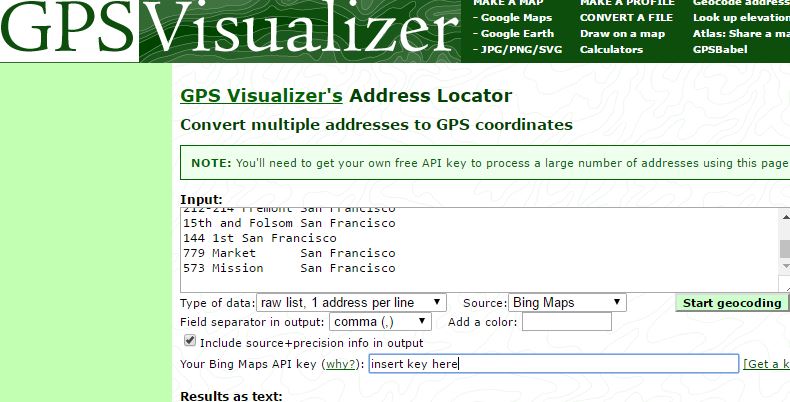
- Next, we'll geocode this data. Go to GPS Visualizer Geocoder.
- Near the top, there is a green text box that alerts you that you'll need your own free API to use this tool. You can use mapquest or bing. DO NOT USE GOOGLE. Take a minute and follow the directions to get an API key and save it -- you will use it again. (I email it to myself with the subject line "bing API code")
- Once you have your code, copy and paste it into the API code area on GPS Visualizer. Go back to your spreadsheet and select the text areas (either [A1:C10] or [A2:C10]) to copy/paste to the input box on GPSVisualizer.
- Type of Data: Select "raw list" if you did not include headers [A2:C10] or "Tabular" if you did include headers [A1:C10]. It will alert you/error out if you choose the wrong one.
- Source: Either Bing or Mapquest, whichever corresponds to your API code.
- Field Separator: Comma
- Add a color: leave blank
- Include source+precision info in output: check box
- Insert API key in the box.
- Click "Start Geocoding" (note if you make an error, click "cancel geocoding" if you'd like to end the process and "clear results box" to start fresh below).
- You should now see "Results as text" filled with results. You can click "Draw a Map" to see how these plots are laid on a map
- Now you can put your data back into your excel file. Copy the entire results box and paste back into your excel doc to the right of your data (Hints: If you used tabular data with headings, it will paste into your excel file into columns neatly. You'll also paste into the header row....If you used raw data, you'll paste into the first open box on the right (D2). Then you'll need to go to "Data" and click "Text to Columns").
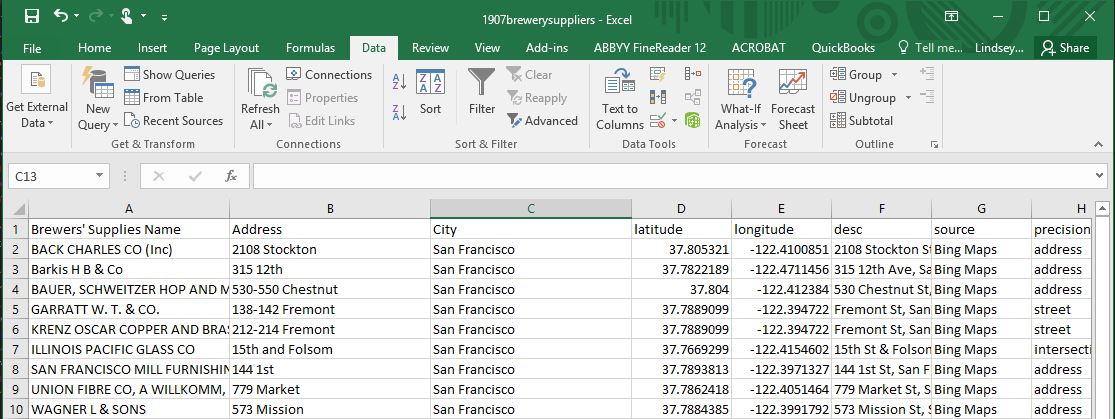
- Now remove unnecessary data columns. Keep Latitude and Longitude for sure. You might also wish to keep "desc" as a nicely formatted full address, or also "source" or "precision". Here's what your final spreadsheet might look like:
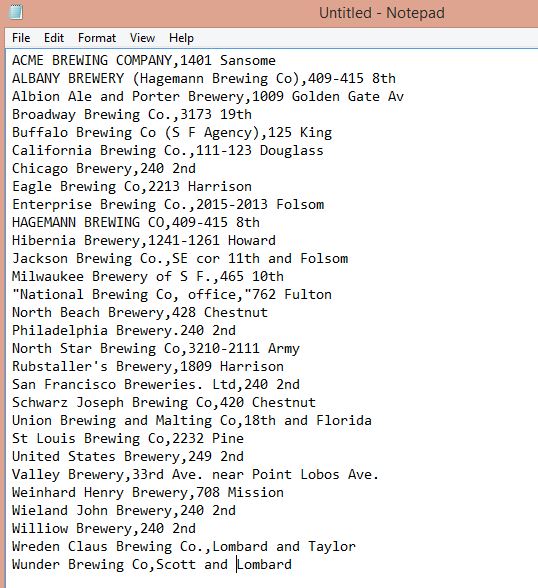
- Before continuing on, let's look at Breweries from the previous page of the phonebook. Can you identify errors / issues in the text file that you might need to address:
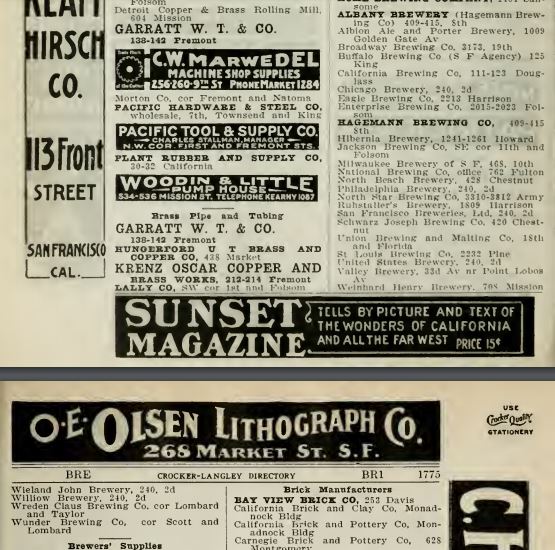
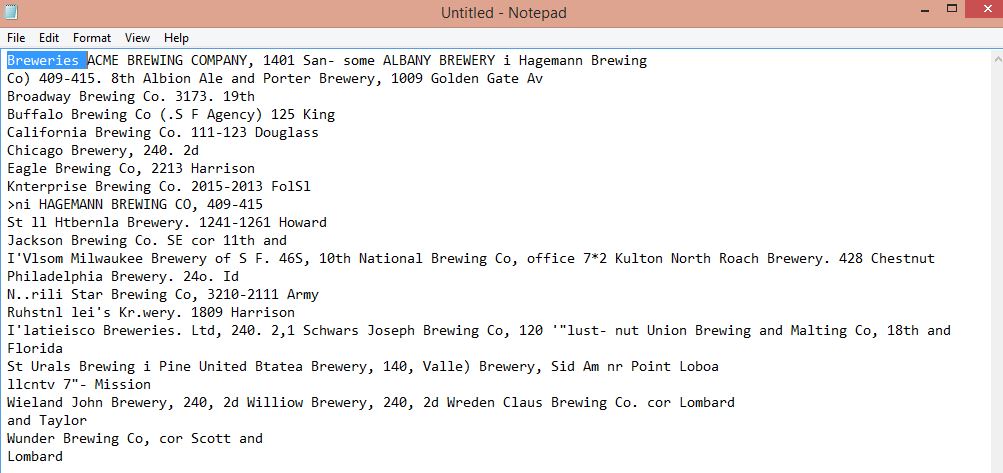
Cleaned up version: